

From raw data to 3D site models
Collect
High-resolution site characterization (HRSC) logging tools capture continuous sensor data at 20 readings per foot across the site. Every location is recorded with GPS coordinates.
Integrate
HRSC data is combined with any existing site data, including monitoring wells, soil borings, and lab results, into a single dataset.
Model
C Tech Development Corporation’s Earth Volumetric Studio (EVS) interpolates between all data points, generating 3D volumes and surface models of contamination and geology.
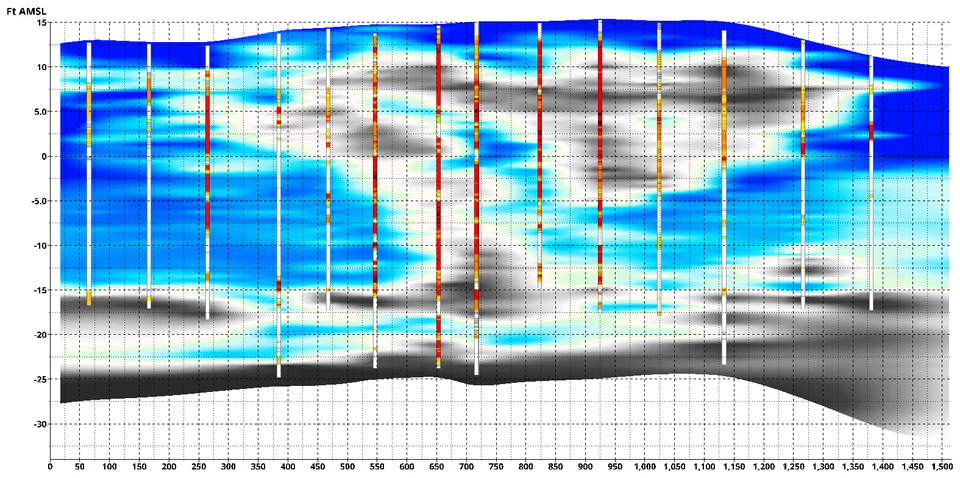
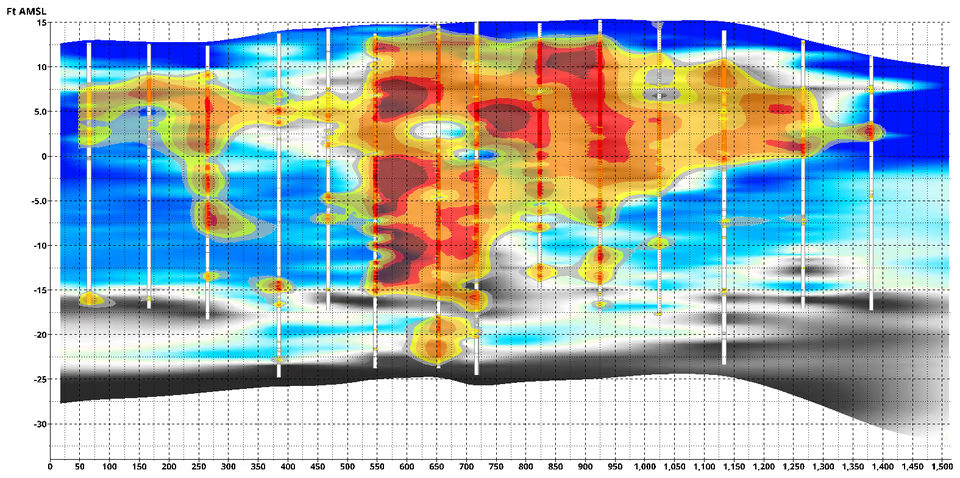 Fluor.%
- 100
- 50
- 20
- 10
- 5.0
- 2.0
- 1.0
- 0.50
Powered by C Tech Development Corporation's Earth Volumetric Studio.
Deliver
Interactive models, cross-sections, and plan-view maps, ready for reports, remedial design, and regulatory submittals.
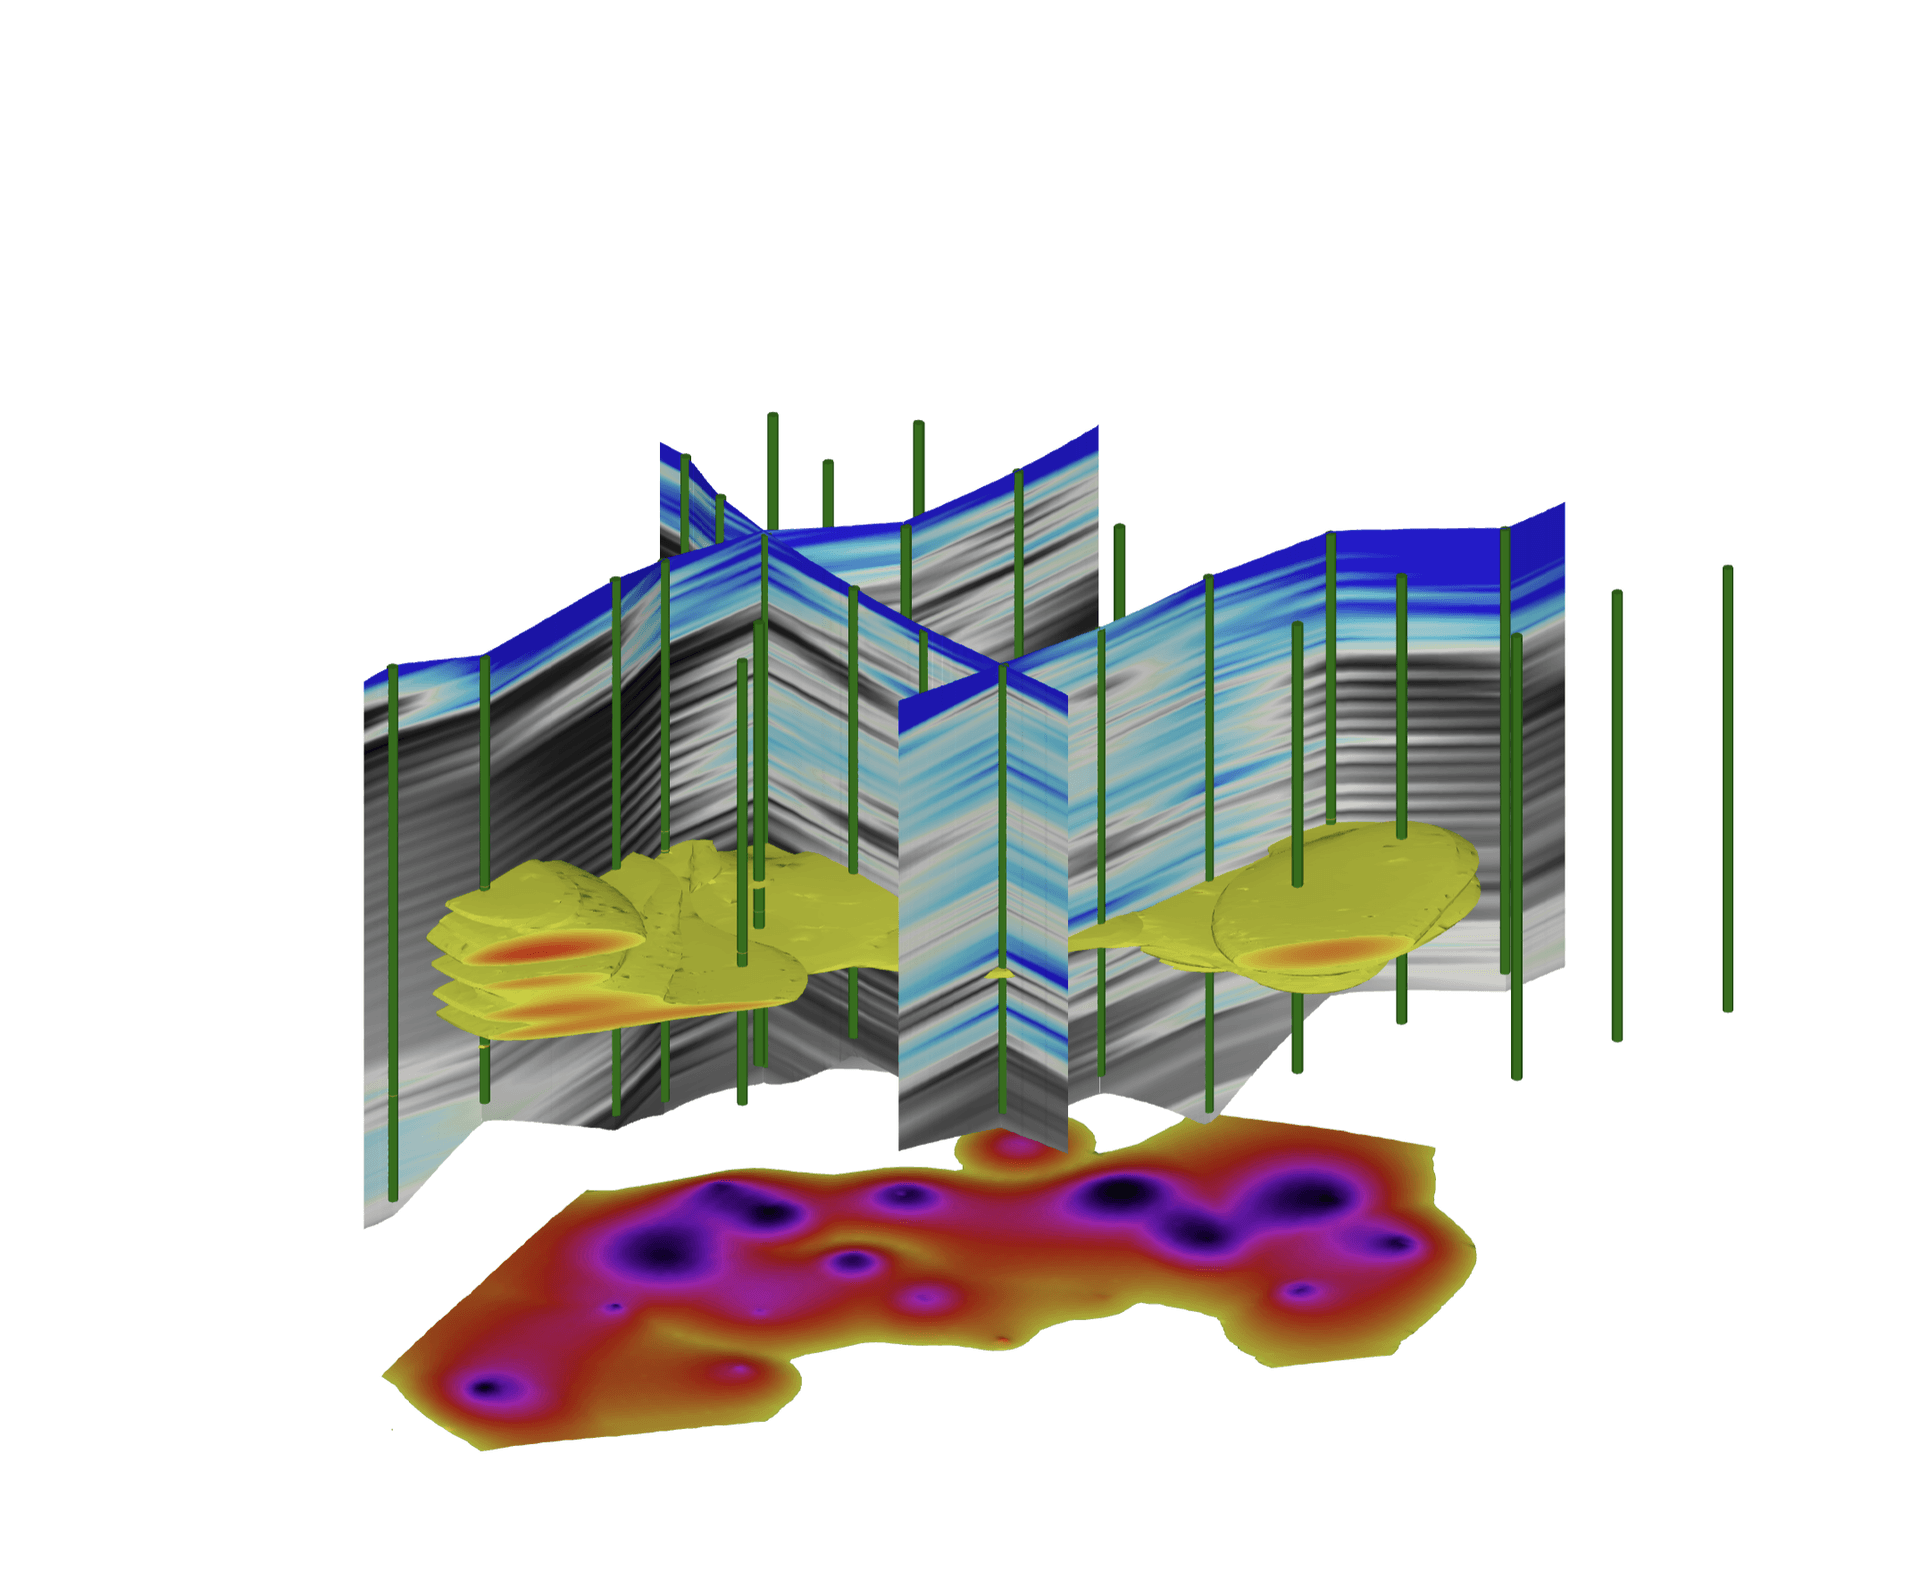
Powered by C Tech Development Corporation's Earth Volumetric Studio. Cross-sections
Vertical slices through the subsurface showing lithology, contamination, and hydraulic data along any transect. Correlate borehole logs across the site to understand lateral continuity of formations and plumes.
3D contamination models
Interactive volumetric models showing the spatial distribution of contamination. Rotate, slice, and explore the plume in three dimensions. Built from OIHPT fluorescence (lamp-induced OIHPT-UV and OIHPT-UVR, or laser-induced OIHPT-G) or MIHPT detector data.
Plan-view maps
Depth-slice maps showing the footprint of the response at specific depth intervals, for remediation targeting and regulatory reporting.
Supporting remedial design
3D models provide the spatial framework for remediation planning, identifying where contamination sits relative to permeable and confining units. Use models to optimize injection well placement, target amendment delivery to the zones that matter, evaluate remediation feasibility, and support remedial design presentations to regulators and stakeholders.
Any site, any contaminant
3D modeling applies wherever spatial understanding of contamination matters. Sites include gas stations, military installations, industrial facilities, and manufactured gas plants; contaminants include petroleum, chlorinated solvents, and PFAS. If you have the data, we can model it.
3D modeling is available with any HRSC investigation, built from the logs on the project dashboard, or on its own from data you already have.